b_prev.gif Go to previous section.

4. Experimental Results

The experimental results include task completion times, speech errors, mouse errors, diagnosis errors, and the subjective questionnaire scores.

4.1 Task Completion Times

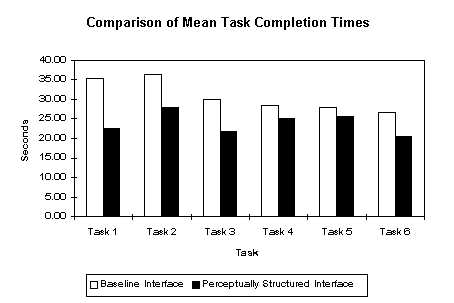
For each participant, a summary of the task completion times is shown in Table 16 as the time to complete the 6 baseline interface tasks, the time to complete the 6 perceptually structured interface tasks, and time improvement (baseline interface time - perceptually structured interface time). The group designation was described in Table 11. For example, B1P2 means the subject used the baseline interface with slides 1 through 6 followed by the perceptually structured interface with slides 7 through 12. The mean improvement for all subjects was 41.468 seconds. A t test on the time improvements was significant (t(19) = 4.791, p < .001, two-tailed). A single-factor ANOVA comparing the baseline and perceptually structured interface times as shown in Table 17 was significant (F(1,38) = 4.719, p < .05, two-tailed). A comparison of mean task completion times is in Figure 3 and a detailed listing of times is in the Appendices in Section 6.9.
Subject Group Time for 
Baseline Tasks
Time for Perceptually 
Structured Tasks
Time 
Improvement


10 
11 
12 
13 
14 
15 
16 
17 
18 
19 
20
B1P2 
B2P1 
P1B2 
P2B1 
B1P2 
B2P1 
P1B2 
P2B1 
B1P2 
B2P1 
P1B2 
P2B1 
B1P2 
B2P1 
P1B2 
P2B1 
B1P2 
B2P1 
P1B2 
P2B1
314.670 
195.230 
172.190 
122.537 
196.192 
120.725 
355.640 
185.867 
129.732 
159.777 
322.795 
128.140 
111.828 
189.546 
153.241 
116.496 
160.161 
209.695 
173.782 
169.341
181.530 
147.770 
130.228 
96.888 
123.021 
106.499 
271.330 
127.708 
104.522 
134.786 
220.524 
103.809 
129.733 
135.226 
132.205 
120.176 
152.416 
133.907 
140.059 
165.892
133.140 
46.460 
41.962 
25.649 
73.171 
14.226 
84.310 
58.159 
25.210 
24.991 
102.271 
24.331 
-17.905 
54.320 
21.036 
-3.680 
7.745 
75.788 
33.723 
3.449
Table 16: Times for the Baseline and Perceptually Structured Interfaces 

grassof3.gif 

Figure 3: Comparison of Mean Task Completion Times
An analysis of variance (ANOVA) was performed to show that the interface order (baseline, perceptually structured) and task order (slide group 1, slide group 2) had no significant effect on the results. A single-factor ANOVA comparing the baseline-first-group and base-interface-second groups is shown in Table 18 was not significant (F(1,18) = 0.123, p = 0.730, two-tailed). A single factor ANOVA comparing the perceptually-structured-interface-first and perceptually-structured-interface-second groups shown in Table 19 was not significant (F(1,18) = 0.723, p = 0.406, two-tailed). A single factor ANOVA comparing the slide-group-one-first and slide-group-one-second groups shown in Table 20 was not significant (F(1,18) = 3.440, p = 0.080, two-tailed). A single factor ANOVA comparing the slide-group-two-first and slide-group-two-second groups shown in Table 21 was not significant (F(1,18) = 1.650, p = 0.215, two-tailed).
Single Factor ANOVA Comparing the Baseline and Perceptually Structured Interface Groups
Group 
Baseline 
Perceptually Structured
Count 
20 
20
Sum 
3687.585 
2858.229
Mean 
184.379 
142.911
Variance 
4891.456 
1731.705
Source of 
Variation 
Between Groups 
Within Groups 
Total
Sum of 
Squares 
17195.78 
125840.054 
143035.838
Degrees of 
Freedom 

38 
39
Mean 
Square 
17195.784 
3311.580
F Value 
5.193
P Value 
0.028
Table 17: ANOVA for Baseline and Perceptually Structured Interfaces
Single Factor ANOVA for the Baseline Interface Group
Group 
Baseline-First 
Baseline-Second
Count 
10 
10
Sum 
1787.556 
1900.029
Mean 
178.756 
190.003
Variance 
3453.106 
6803.022
Source of 
Variation 
Between Groups 
Within Groups 
Total
Sum of 
Squares 
632.509 
92305.146 
92937.655
Degrees of 
Freedom 

18 
19
Mean 
Square 
632.509 
5128.064
F Value 
0.123
P Value 
0.730
Table 18: Single Factor ANOVA for Baseline Groups
Single Factor ANOVA for the Perceptually Structured Interface Group
Group 
Perceptually-Structured-First 
Perceptually-Structured-Second
Count 
10 
10
Sum 
1508.819 
1349.410
Mean 
150.882 
134.941
Variance 
3009.633 
505.016
Source of 
Variation 
Between Groups 
Within Groups 
Total
Sum of 
Squares 
1270.561 
31631.837 
32902.399
Degrees of 
Freedom 

18 
19
Mean 
Square 
1270.561 
1757.324
F Value 
0.723
P Value 
0.406
Table 19: Single Factor ANOVA for Perceptually Structured Groups
Single Factor ANOVA for Slide Group 1
Group 
Slide-Group-One-First 
Slide-Group-One-Second
Count 
10 
10
Sum 
1806.929 
1380.569
Mean 
180.693 
138.057
Variance 
4700.170 
577.196
Source of 
Variation 
Between Groups 
Within Groups 
Total
Sum of 
Squares 
19089.142 
47496.294 
56585.436
Degrees of 
Freedom 

18 
19
Mean 
Square 
9089.142 
2638.683
F Value 
3.445
P Value 
0.080
Table 20: Single Factor ANOVA for Slide Group 1 Groups
Single Factor ANOVA for Slide Group 2
Group 
Slide-Group-Two-First 
Slide-Group-Two-Second
Count 
10 
10
Sum 
1489.446 
868.870
Mean 
148.945 
186.887
Variance 
1634.229 
7090.527
Source of 
Variation 
Between Groups 
Within Groups 
Total
Sum of 
Squares 
7198.129 
78522.803 
85720.932
Degrees of 
Freedom 

18 
19
Mean 
Square 
7198.129 
4362.378
F Value 
1.650
P Value 
0.215 
Table 21: Single Factor ANOVA for Slide Group 2 Groups

4.2 Errors

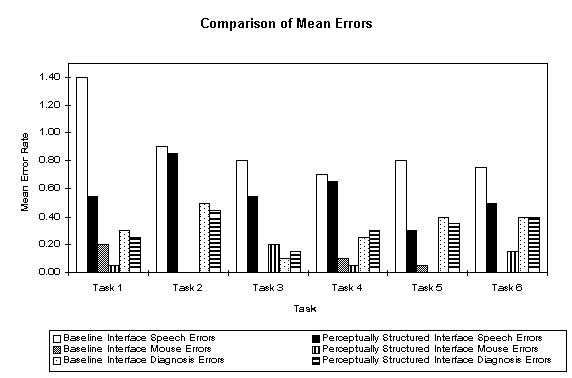
Three types of user errors were recorded: speech recognition errors, mouse errors, and diagnosis errors. A summary of error rates for each participant is shown in Table 22. A detailed listing of errors is in the Appendices in Section 6.10, Section 6.11, and Section 6.12. For speech errors, the baseline interface had mean of 5.35 and the perceptually structured interface had mean of 3.40. The reduction in speech errors was significant (paired t(19) = 2.924, p < .01, two-tailed). For mouse errors, the baseline interface had mean of 0.35 and the perceptually structured interface had mean of 0.45. Although the baseline interface had fewer mouse errors, these results were not significant (paired t(19) = 0.346, p = .733, two-tailed). For diagnosis errors, the baseline interface had mean of 1.95 and the perceptually structured interface had mean of 1.90. Again, although the rate for the perceptually structured interface was slightly better, these results were not significant (paired t(19) = 0.181, p = 0.858, two-tailed). A comparison of mean error rates by task is shown in Figure 4.
Speech Errors Mouse Errors Diagnosis Errors
Subject Group Baseline Perceptually 
Structured
Baseline Perceptually 
Structured
Baseline Perceptually 
Structured


10 
11 
12 
13 
14 
15 
16 
17 
18 
19 
20
B1P2 
B2P1 
P1B2 
P2B1 
B1P2 
B2P1 
P1B2 
P2B1 
B1P2 
B2P1 
P1B2 
P2B1 
B1P2 
B2P1 
P1B2 
P2B1 
B1P2 
B2P1 
P1B2 
P2B1


!0 


5


3


0


0


3


1
Table 22: Baseline and Perceptually Structured Error Rates
grassof4.gif
Figure 4: Comparison of Mean Errors

4.3 Acceptability

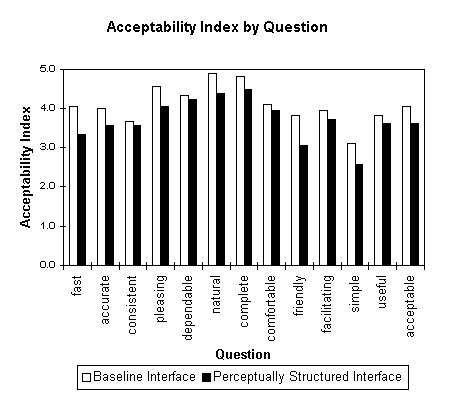
For analyzing the subjective scores, an acceptability index (AI) was defined as the mean scale response for each question across all participants. A lower AI was indicative of higher user acceptance. The overall AI was 3.81 for the baseline interface and 3.72 for the perceptually structured interface, with 10 of 13 questions showing improvement. The results were not significant (p = .187) using a 2x13 ANOVA with repeated measures, comparing the 2 interfaces for the 13 questions. However, one subject's score was more than 2 standard deviations outside the mean AI (subject 17). With this outlier removed, the baseline interface AI was 3.99 and the perceptually structured interface was 3.63, which was a modest 6.7% improvement. All 13 questions showed improvement, and the result was significant using the 2x13 ANOVA as shown in Table 23 (p = .014). A comparison of these values is shown in Figure 5 and a summary of all acceptability scores is in the Appendices in Section 6.9.
Two-Factor ANOVA With Replication for Acceptability Index
SUMMARY Q1 Q2 Q3 Q4 Q5 Q6 Q7 Q8 Q9 Q10 Q11 Q12 Q13 Total
Baseline Interface
Count 
Sum 
Average 
Variance
19 
75 
3.95 
3.27
19 
74 
3.89 
1.99
19 
68 
3.58 
2.48
19 
84 
4.42 
3.37
19 
80 
4.21 
2.51
19 
91 
4.79 
2.73
19 
91 
4.79 
1.95
19 
76 
4.00 
2.11
19 
71 
3.74 
2.20
19 
73 
3.84 
2.70
19 
57 
3.00 
2.89
19 
70 
3.68 
4.12
19 
75 
3.95 
2.27
247 
985 
3.99 
2.75
Perceptually Structured Interface
Count 
Sum 
Average 
Variance
19 
62 
3.26 3.20
19 
66 3.47 2.26
19 
66 
3.47 2.15
19 
75 
3.95 3.50
19 
78 4.11 2.88
19 
82 4.32 2.23
19 
85 4.47 2.82
19 
74 
d3.89 2.54
19 
57 3.00 2.67
19 
70 3.68 2.67
19 
48 2.53 1.60
19 
66 3.47 3.49
19 
67 3.53 2.26
247 
896 3.63 2.77
Total
Count 
Sum 
Average 
Variance
38 
137 3.61 3.27
38 
140 3.68 2.11
38 
134 3.53 2.26
38 
159 4.18 3.40
38 
158 4.16 2.62
38 
173 4.55 2.47
38 
176 4.63 2.35
38 
150 3.95 2.27
38 
128 3.37 2.51
38 
143 3.76 2.62
38 
105 2.76 2.24
38 
136 3.58 3.71
38 
142 3.74 2.25
ANOVA
Source of Variation SS df MS F P-Value F Critical
Sample 
Columns 
Interaction 
Within 
Total
16.034 113.862 5.255 1239.579 
1374.731

12 
12 
468 
493
16.034 9.489 
0.438 
2.649
6.054 3.582 0.165 0.014 0.000 0.999 3.861 1.773 1.773
Table 23: Two-Factor ANOVA for AI
 
grassof5.gif
Figure 5: Comparison of Acceptability Index by Question

4.4 Correlation

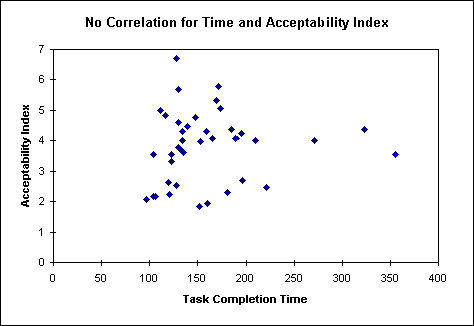
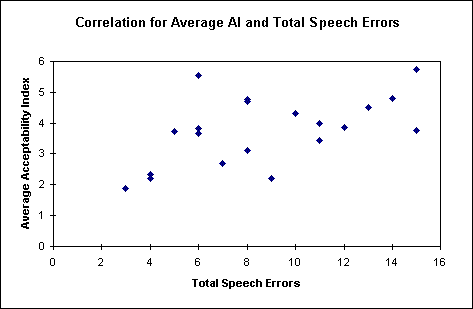
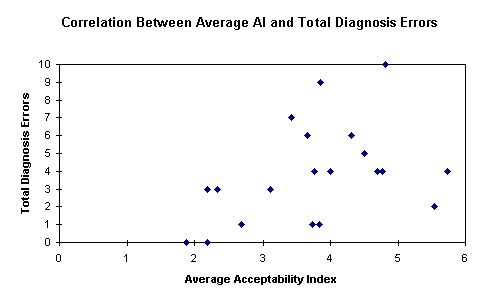
The relationship between the dependent variables was analyzed using the Pearson correlation coefficient. These are time (T), speech errors (SE), mouse errors (ME), diagnosis errors (DE), and acceptability index (AI) from the baseline group, perceptually structured group, and both groups together. A summary of these coefficients is in Table 24. Representative graphs are shown in Figure 6, Figure 7, and Figure 8.
Variables Sample 
Size
r value Significant p value
Baseline Interface x Perceptually Structured Interface 
Baseline T x Perceptually Structured T 
Baseline SE x Perceptually Structured SE 
Baseline ME x Perceptually Structured ME 
Baseline ME x Perceptually Structured DE
20 
20 
20 
20
0.893 
0.223 
0.122 
0.667
p < .001, two-tailed 

p < .001, two-tailed 
p < .001, two-tailed

T x SE 
Baseline T x Baseline SE 
Perceptually Structured T x Perceptually Structured SE 
T x SE 
T Improvement x Total SE
20 
20 
40 
20
0.322 
0.536 
0.471 
0.339
p < .05, two-tailed 
p < .01, two-tailed
T x ME 
Baseline T x Baseline ME 
Perceptually Structured T x Perceptually Structured ME 
T x ME 
T Improvement x Total ME
20 
20 
40 
20
0.163 
0.641 
0.313 
0.225
p < .01, two-tailed 
p < .05, two-tailed
T x DE 
Baseline T x Baseline DE 
Perceptually Structured T x Perceptually Structured DE 
T x DE 
T Improvement x Total DE
20 
20 
40 
20
0.082 
0.228 
0.131 
0.091
T x AI 
Baseline T x Baseline AI 
Perceptually Structured T x Perceptually Structured AI 
T x AI 
T Improvement x Total AI
20 
20 
40 
20
-0.120 
0.018 
-0.021 
0.134
AI x SE 
Baseline AIx Baseline SE 
Perceptually Structured AIx Perceptually Structured SE 
AI x SE 
Total AI x Total SE
20 
20 
40 
20
0.264 
0.353 
0.324 
0.543


p < .05, two-tailed 
p < .05, two-tailed

AI x ME 
Baseline AIx Baseline ME 
Perceptually Structured AIx Perceptually Structured ME 
AI x ME 
Total AI x Total ME
20 
20 
40 
20
-0.489 
-0.039 
-0.187 
-0.237
p < .05, two-tailed 
 
AI x DE 
Baseline AIx Baseline DE 
Perceptually Structured AIx Perceptually Structured DE 
AI x DE 
Total AI x Total DE
20 
20 
40 
20
0.425 
0.394 
0.407 
0.419
p < .05, two-tailed 

p < .01, two-tailed

Table 24: Pearson Correlation Coefficients for Dependent Variables
grassof6.gif
Figure 6: No Correlation Between Time and Acceptability Index
grassof7.gif
Figure 7: Correlation Between Average AI and Total Speech Errors
grassof8.gif
Figure 8: Correlation Between Average AI and Total Diagnosis Errors

b_next.gif Go to next section.